This post is from 2012, about 14 years ago. Some of it may be out of date.
▸ Change Your Debugging Life With PonyDebugger
Jake MarshThe team at @Square have released another amazing tool for native iOS development.
PonyDebugger is a remote debugging toolset. It is a client library and gateway server combination that uses Chrome Developer Tools on your browser to debug your application’s network traffic and managed object contexts. To use PonyDebugger, you must implement the client in your application and connect it to the gateway server. There is currently an iOS client and the gateway server.
I don’t think I can possibly explain how incredible this tool is. Go to Github and start using it right now. Also be sure to check out the Square Engineering team’s post about PonyDebugger.
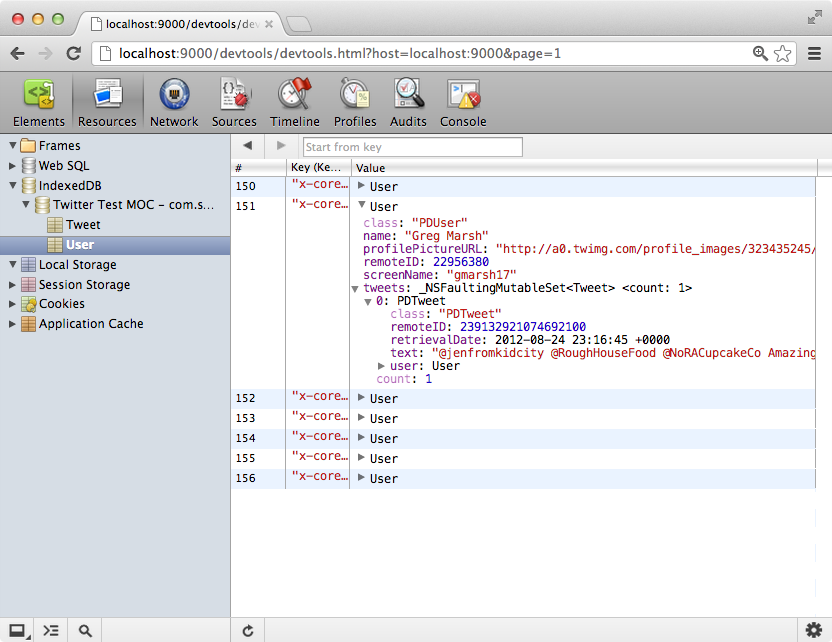
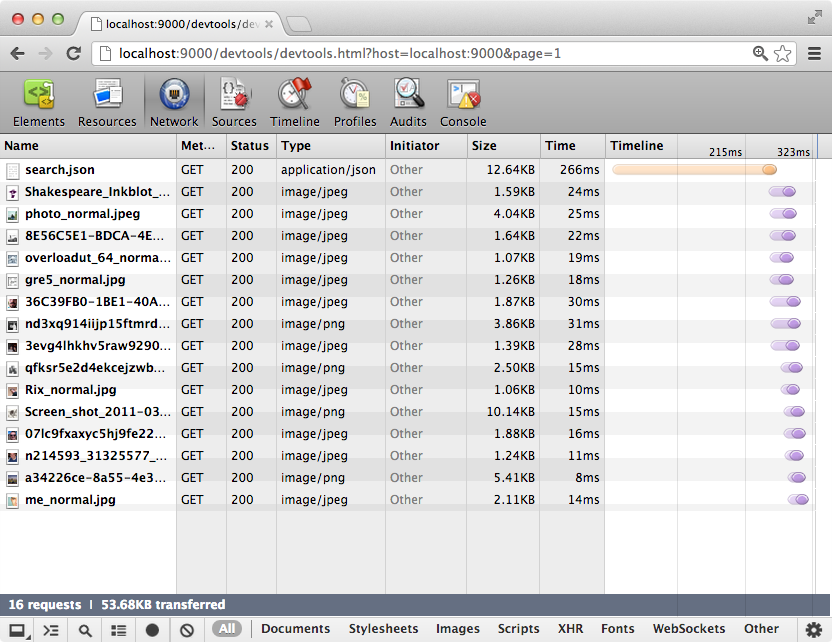
Here’s a couple screenshots to get you as excited as I am:
(Remember, though it visually resembles debugging a web page, this is all depicting a debugging session of a native iOS application’s HTTP requests and CoreData storage!)
Network Traffic Debugging#
Core Data Browser#